
Bradley has released its annual statistical profile, which details the university’s enrollment in various categories, including gender, ethnicity, place of residence and overall population.
Here are some of the key details from this year’s profile.
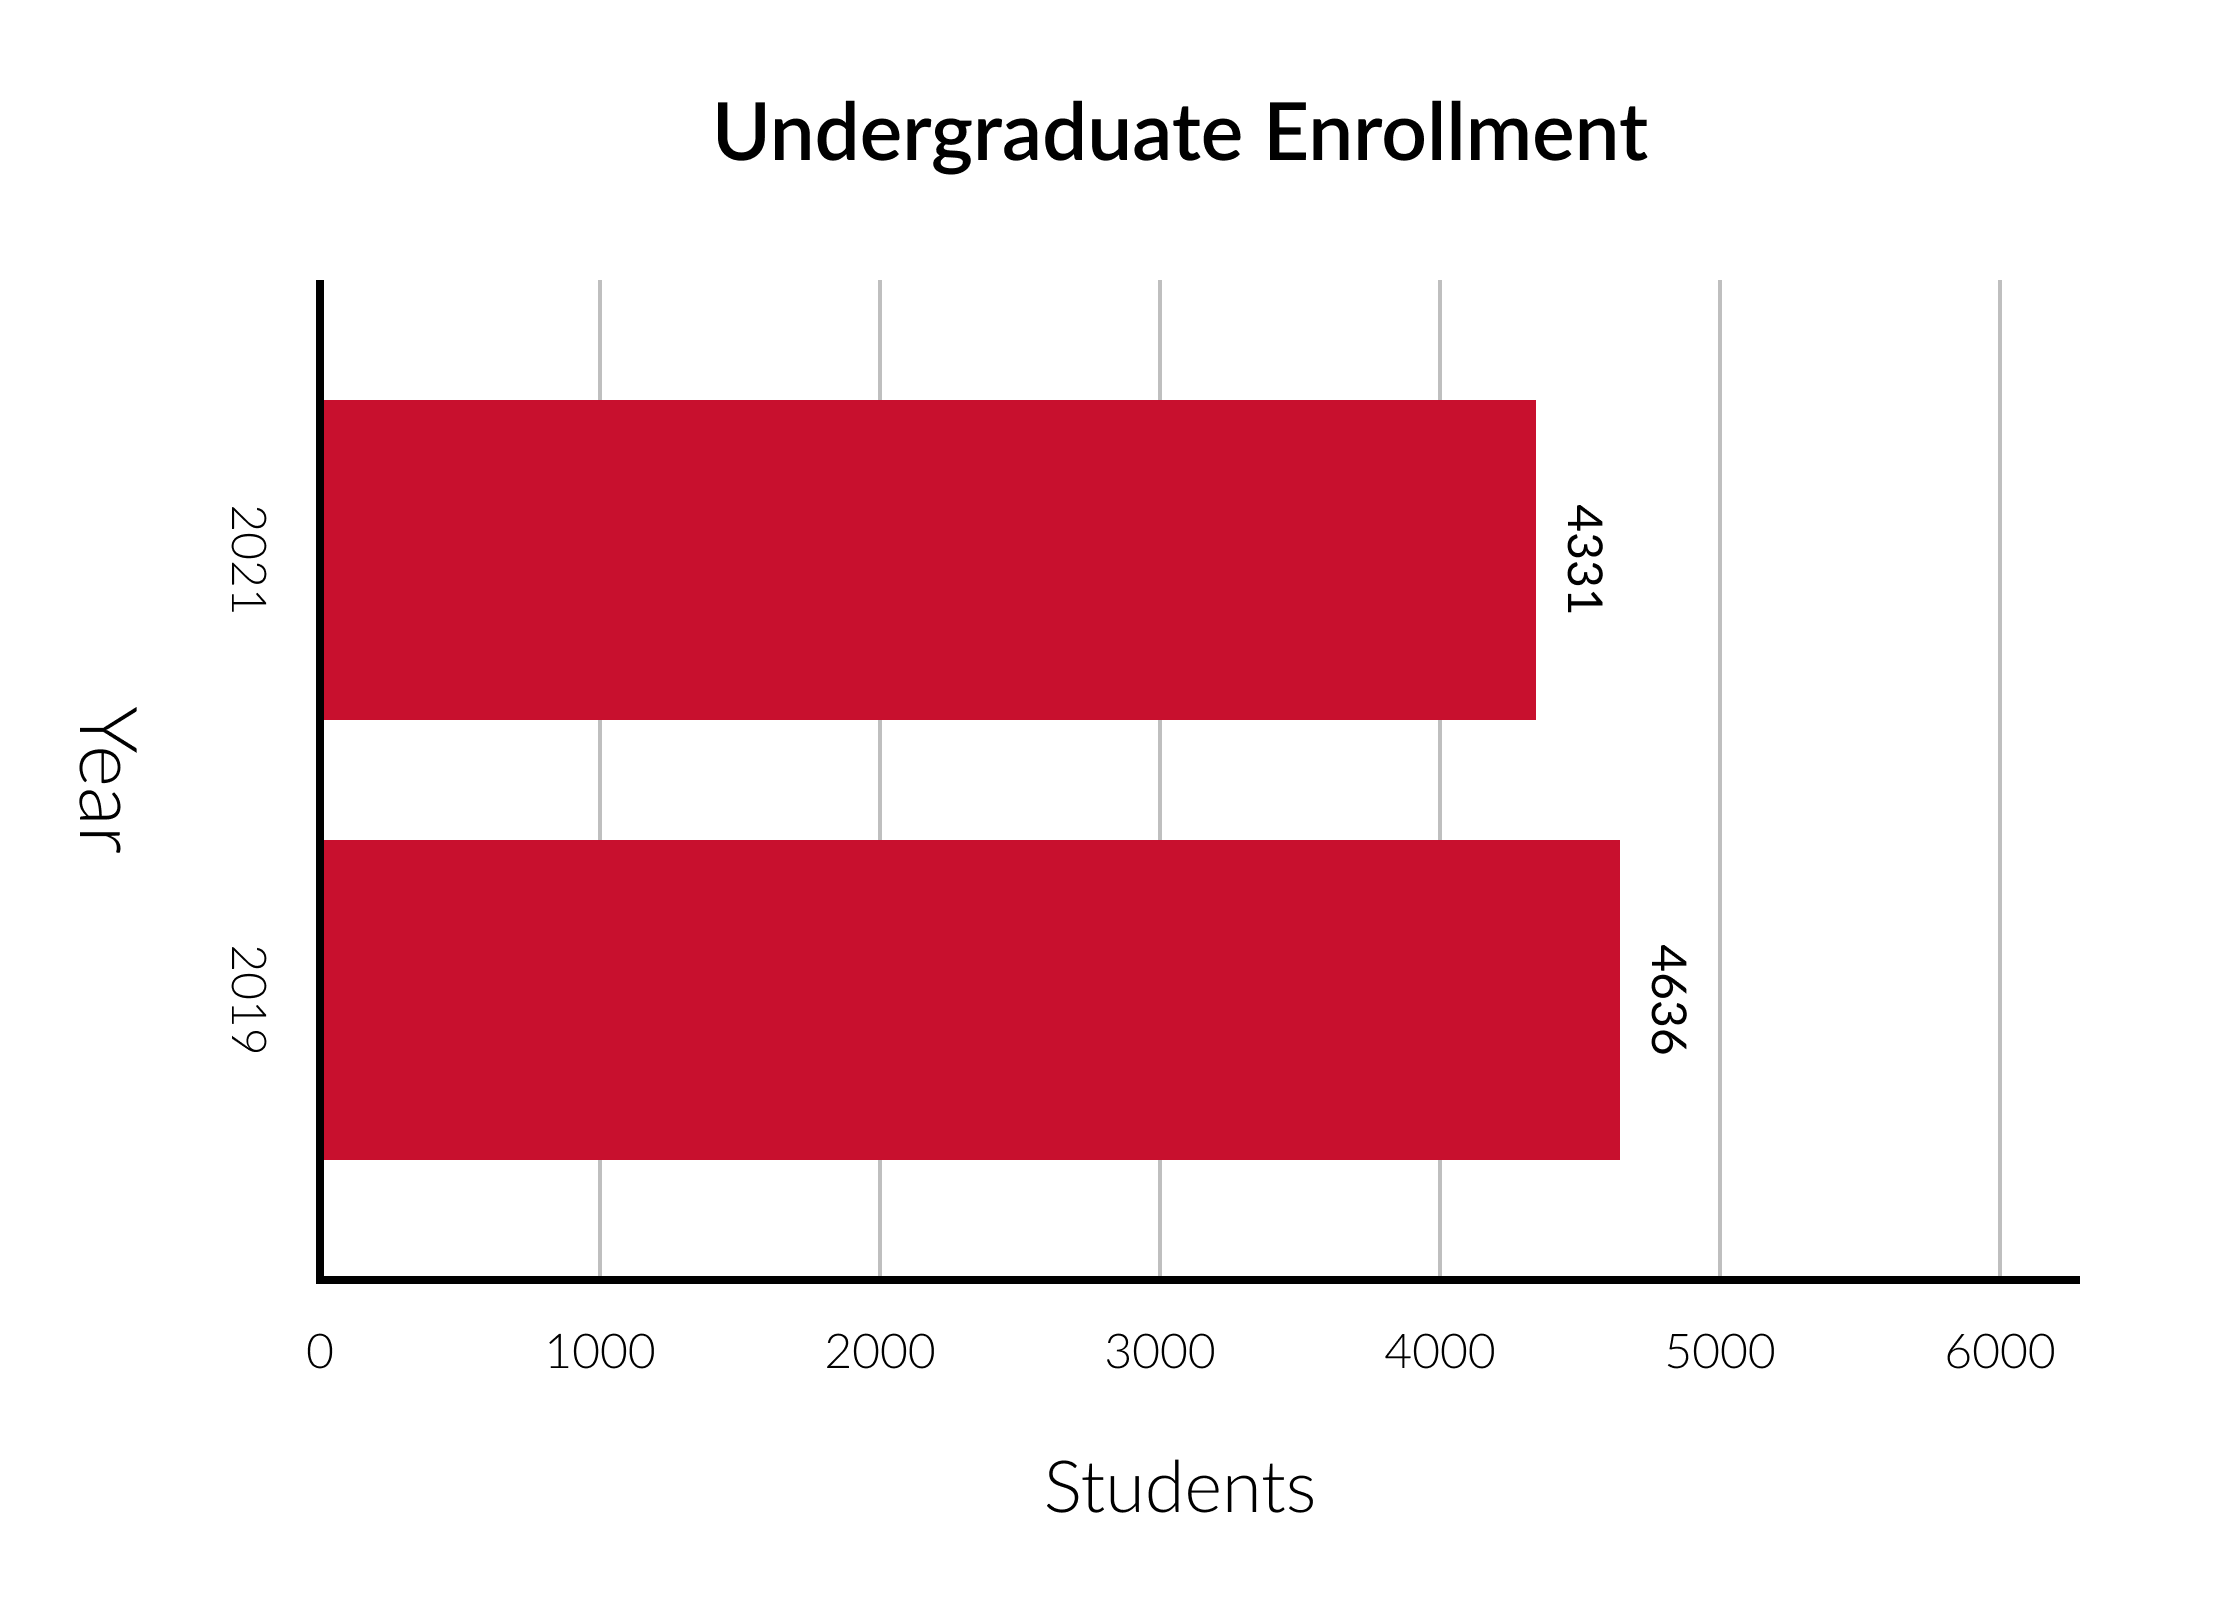
Enrollment is declining
The COVID-19 pandemic has taken a toll on Bradley’s undergraduate enrollment. While 2019’s fall undergraduate enrollment was at 4,636 students, 2021’s fall enrollment is at 4,331 students — almost a 7% decline.
All five of the university’s colleges additionally saw decreased enrollment over the last two years. The Foster College of Business took the steepest hit, seeing a 15% decrease in enrollment since 2019. The Caterpillar College of Engineering & Technology and the College of Education & Health Sciences both took 10% hits.
Notably, Bradley’s Academic Exploration Program has seen an uptick in enrollment, boosting its enrollment from 199 students in 2019 to 223 in 2020 to now 239 this year — a 20% increase over two years.
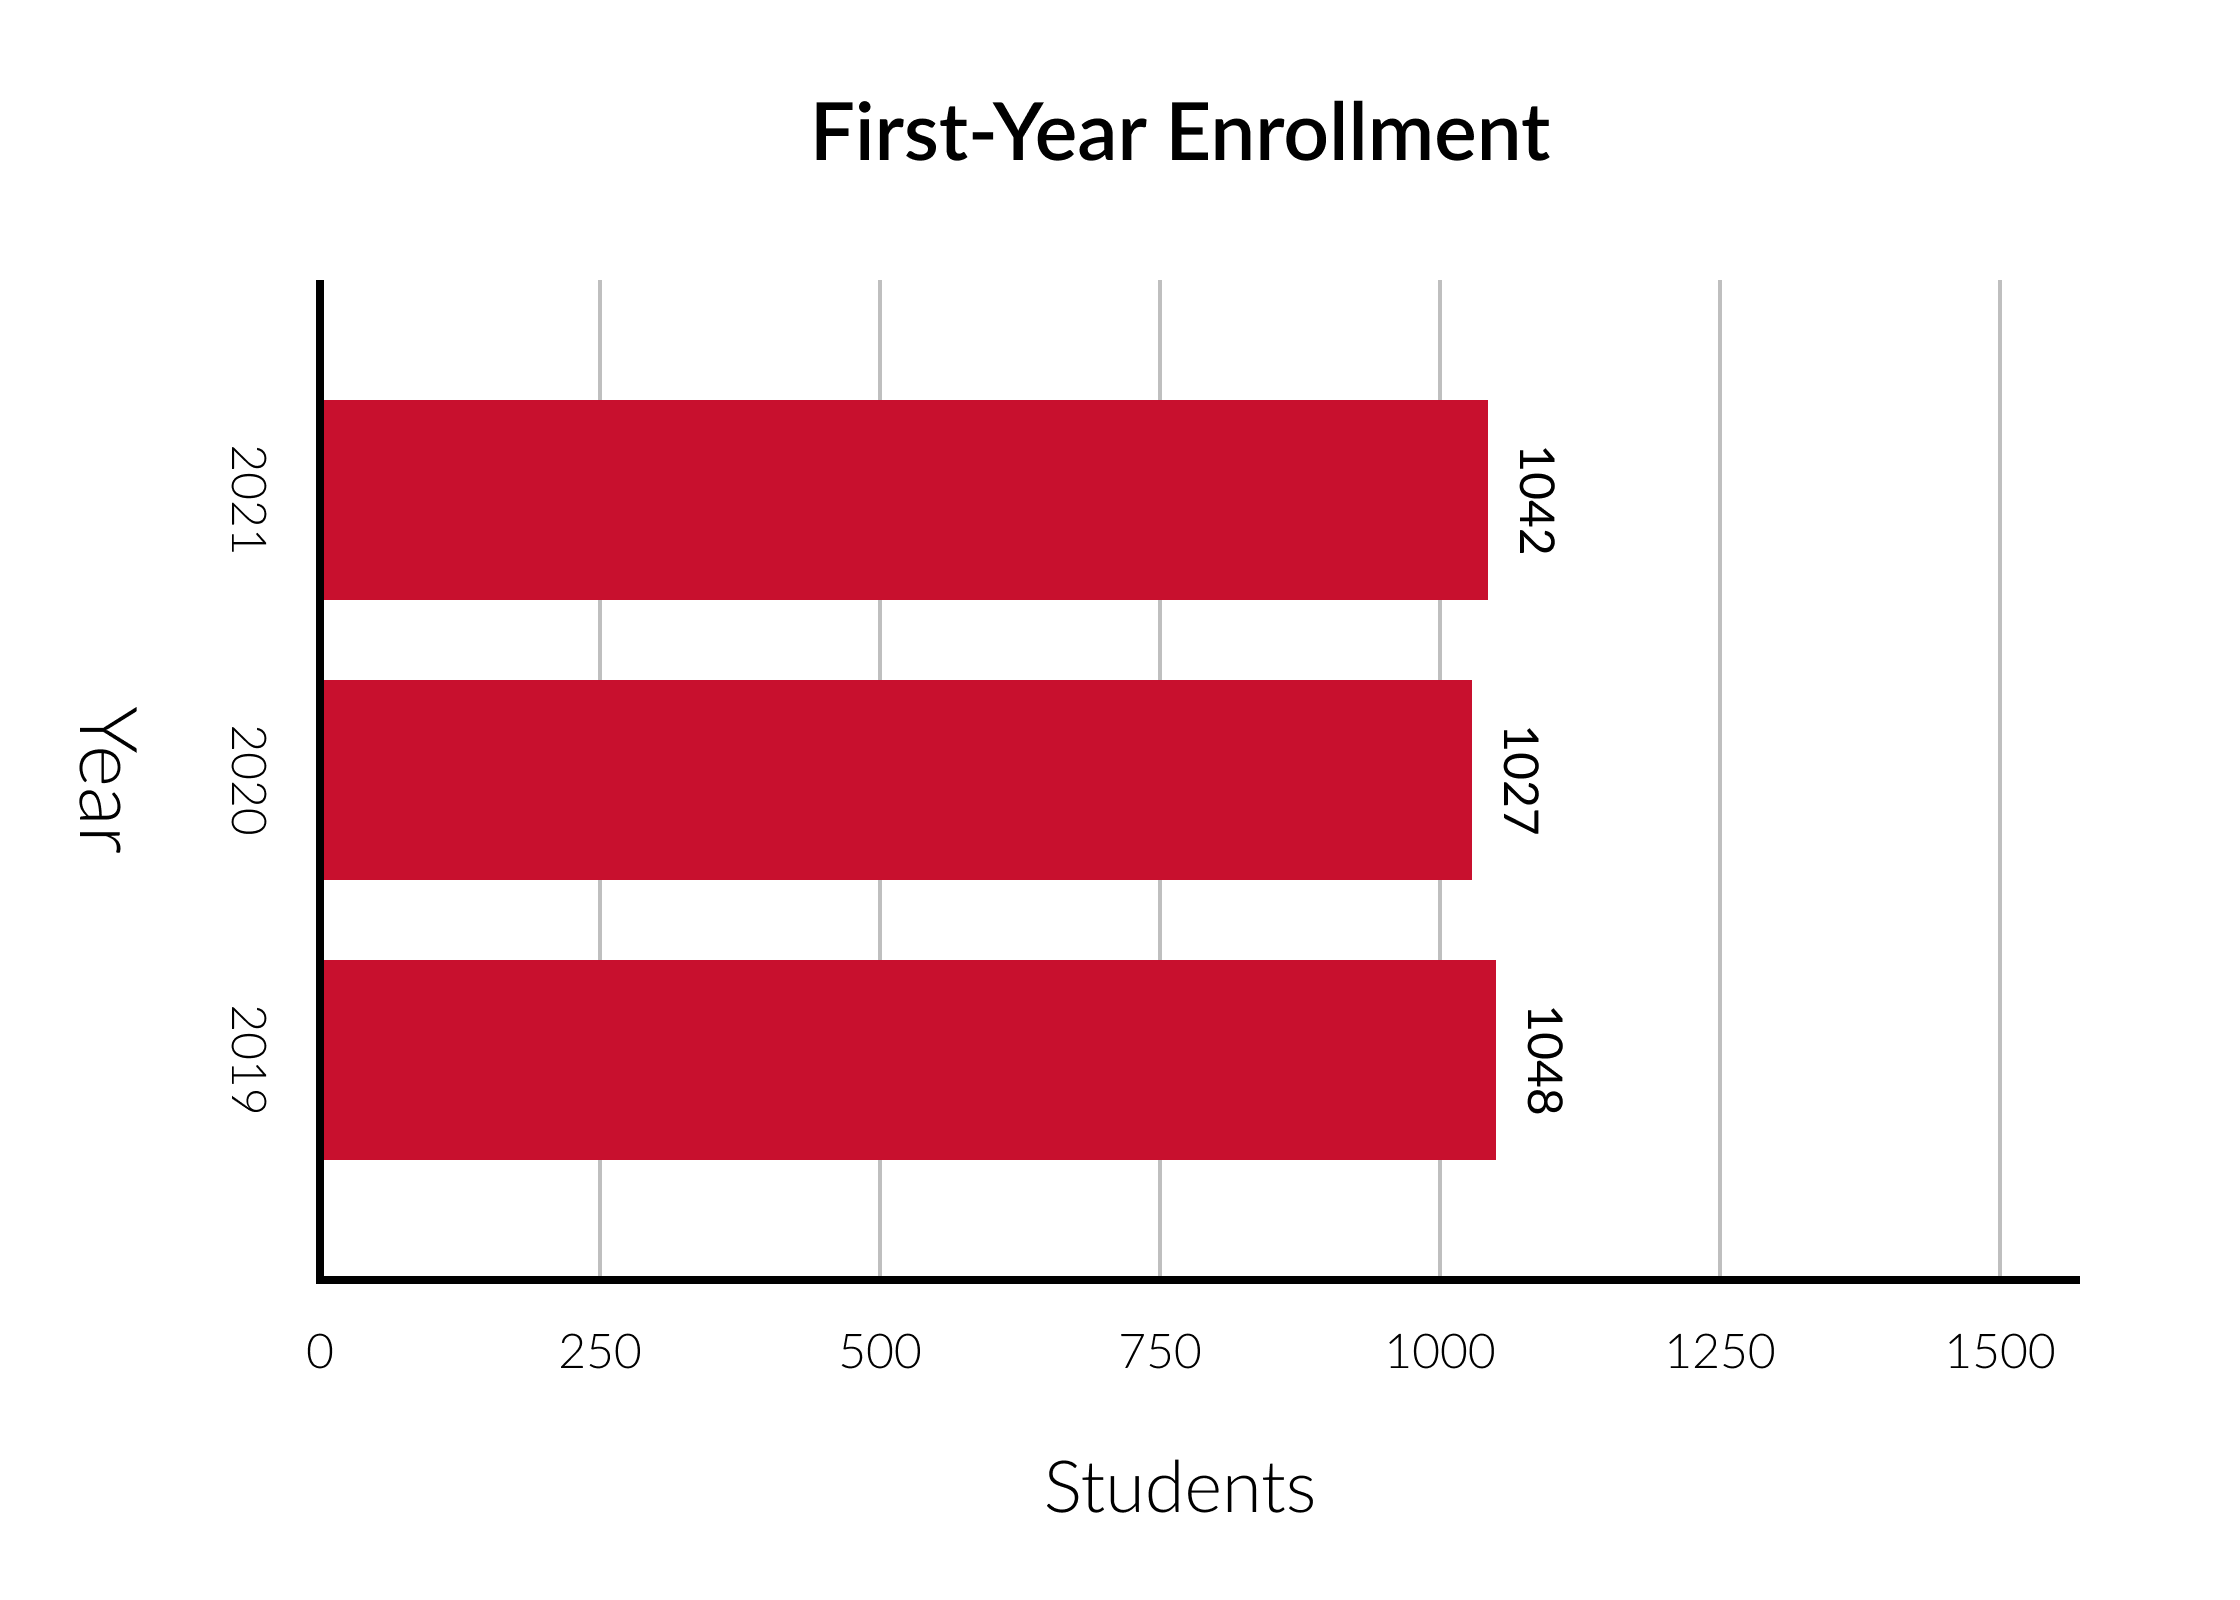
First-year enrollment bounces back
After declining from 2019 to 2020, first-year enrollment bounced back in 2021. The university welcomed 1,042 first-year students to campus this semester — an increase of 15 students from last year.
Justin Ball, vice president for enrollment management, believes that the increase is due to a shift in admissions strategy amidst the pandemic.
“Our Admission team, STARs [student tour guides] and faculty did amazing work in making this pivot,” Ball said in an email interview. “This is why we had such a successful year when other universities struggled with recruitment and their new student numbers.”
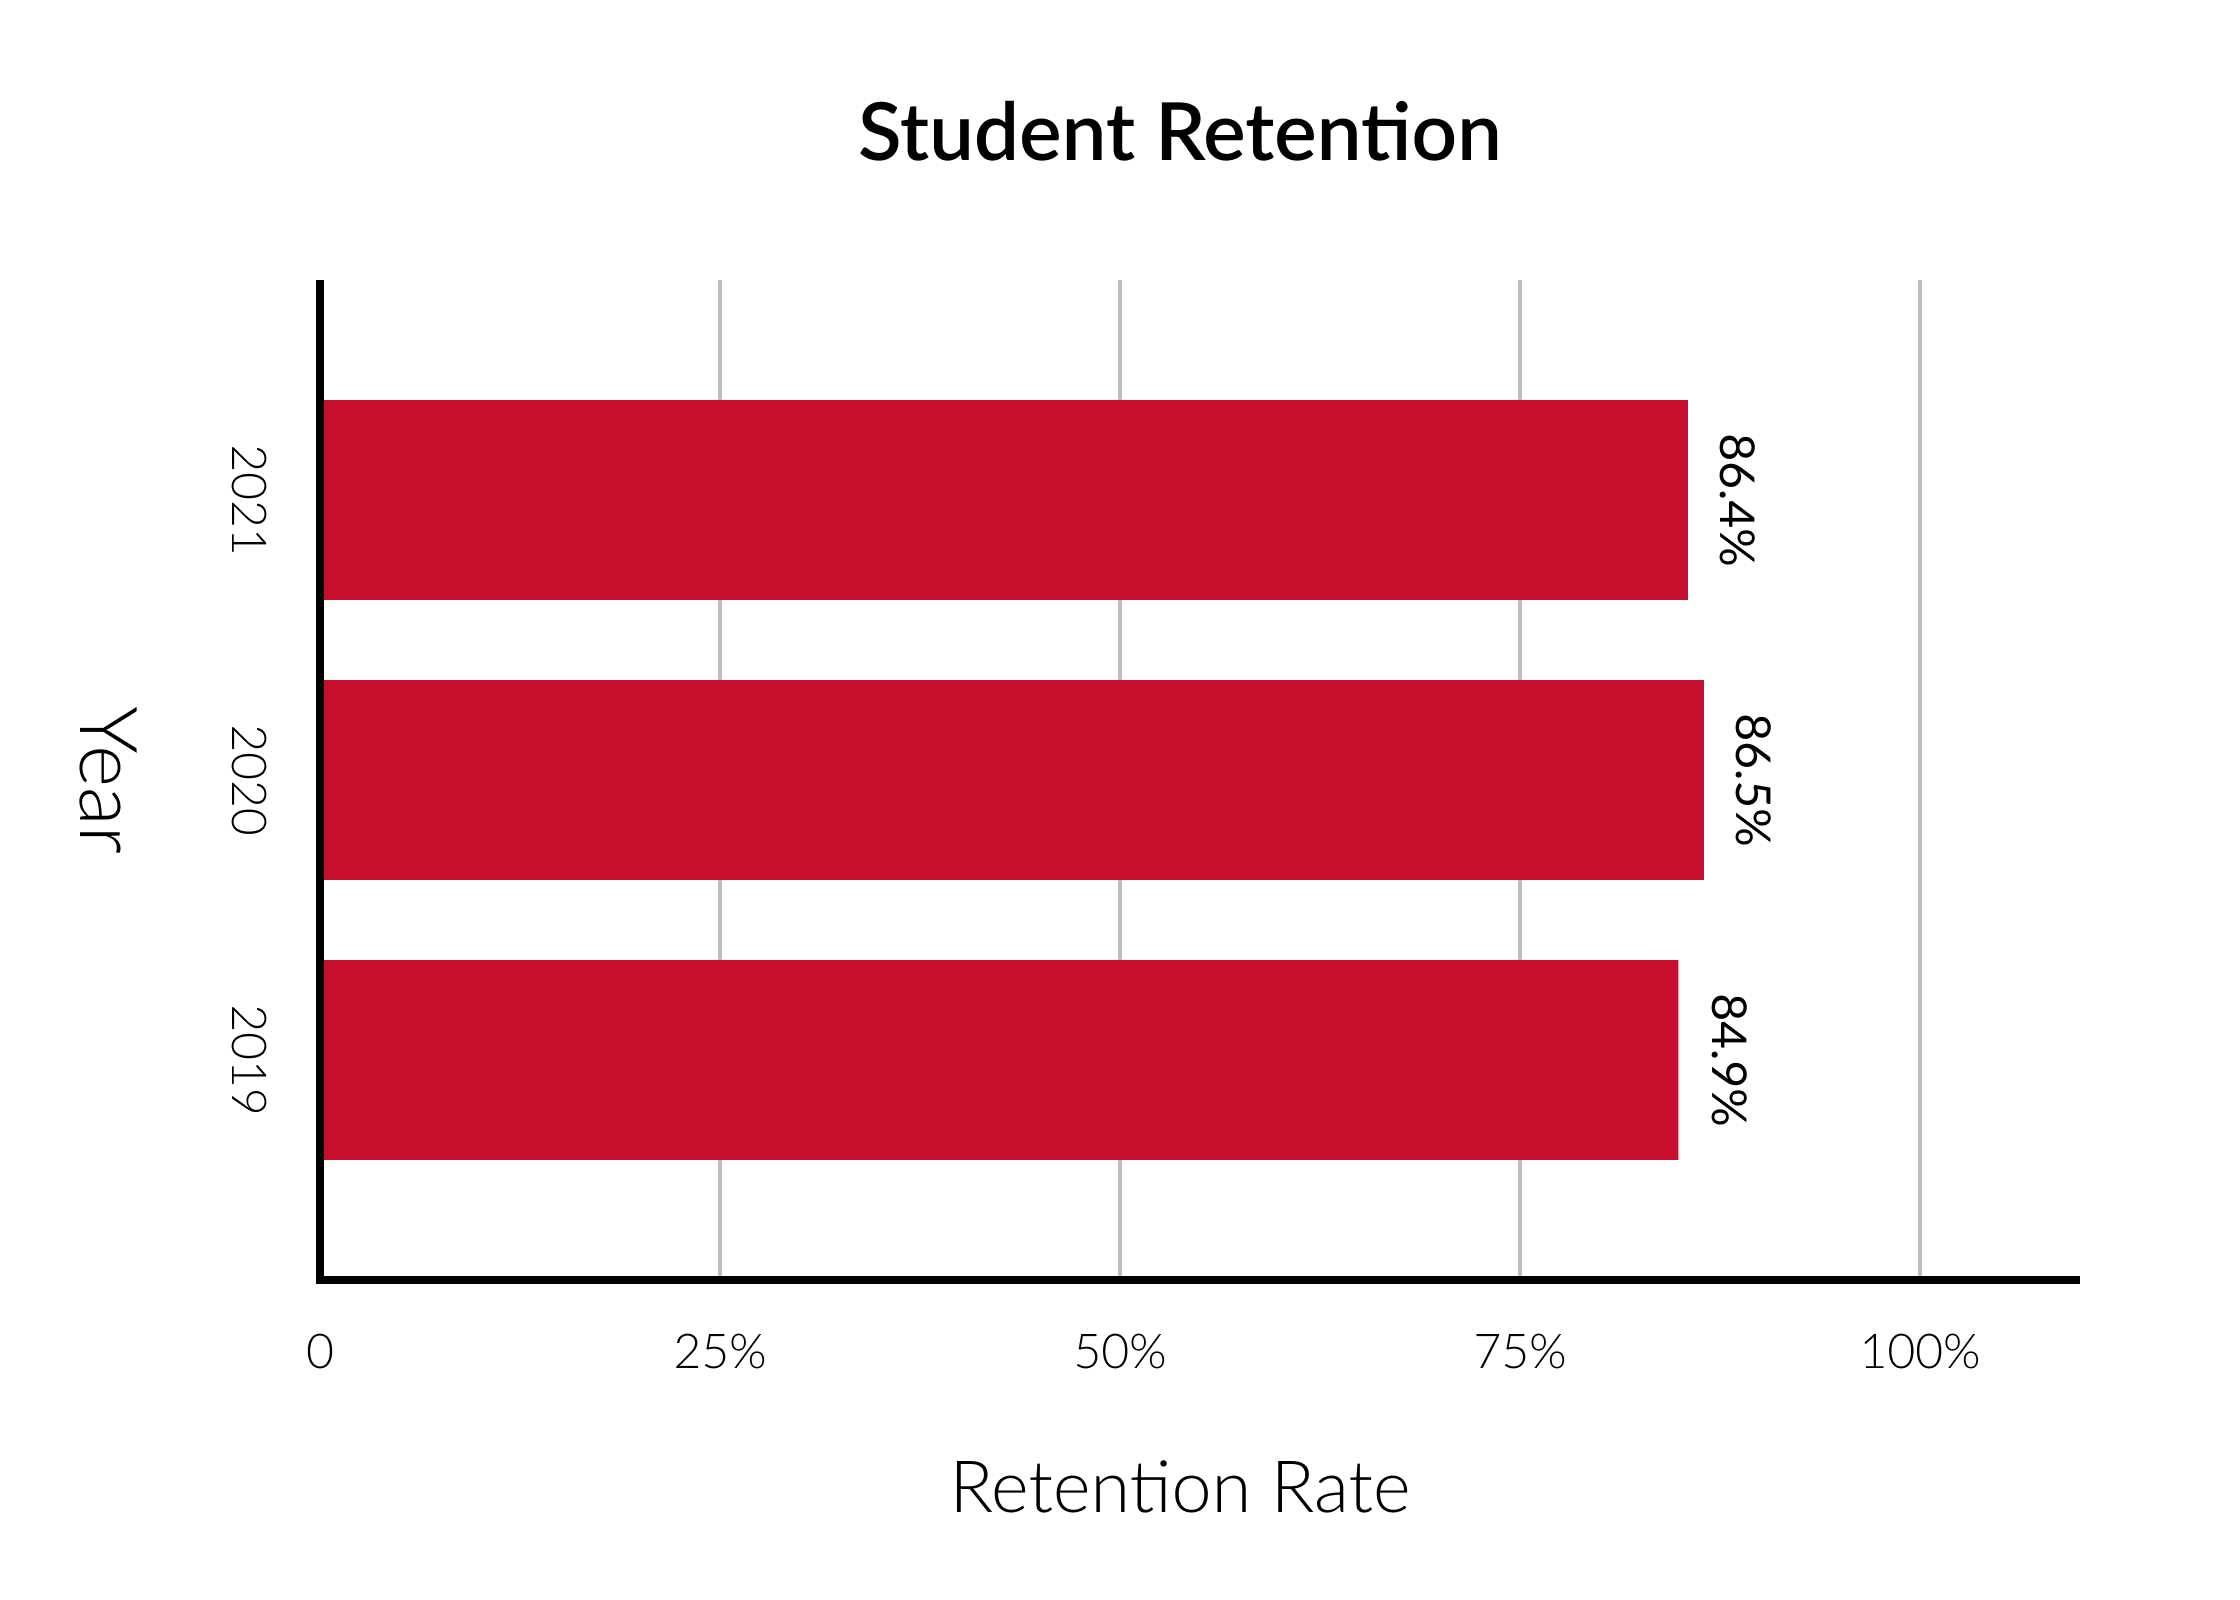
Retention holds firm
While overall enrollment numbers have decreased, Bradley’s first-year student retention rate has remained remarkably consistent over the past three years.
The university’s retention rate of 2020 first-year students was 86.4%, just one-tenth below last year’s rate of 86.5%.
“In these turbulent times, our students continue to see the value and quality of a Bradley education both in and out of the classroom,” vice president for student affairs Nathan Thomas said via email. “There are a number of activities we have launched to impact these numbers like utilization of Student Engagement teams, Supplemental Instruction in some key courses, direct outreaches to students, and even student stability during COVID.”
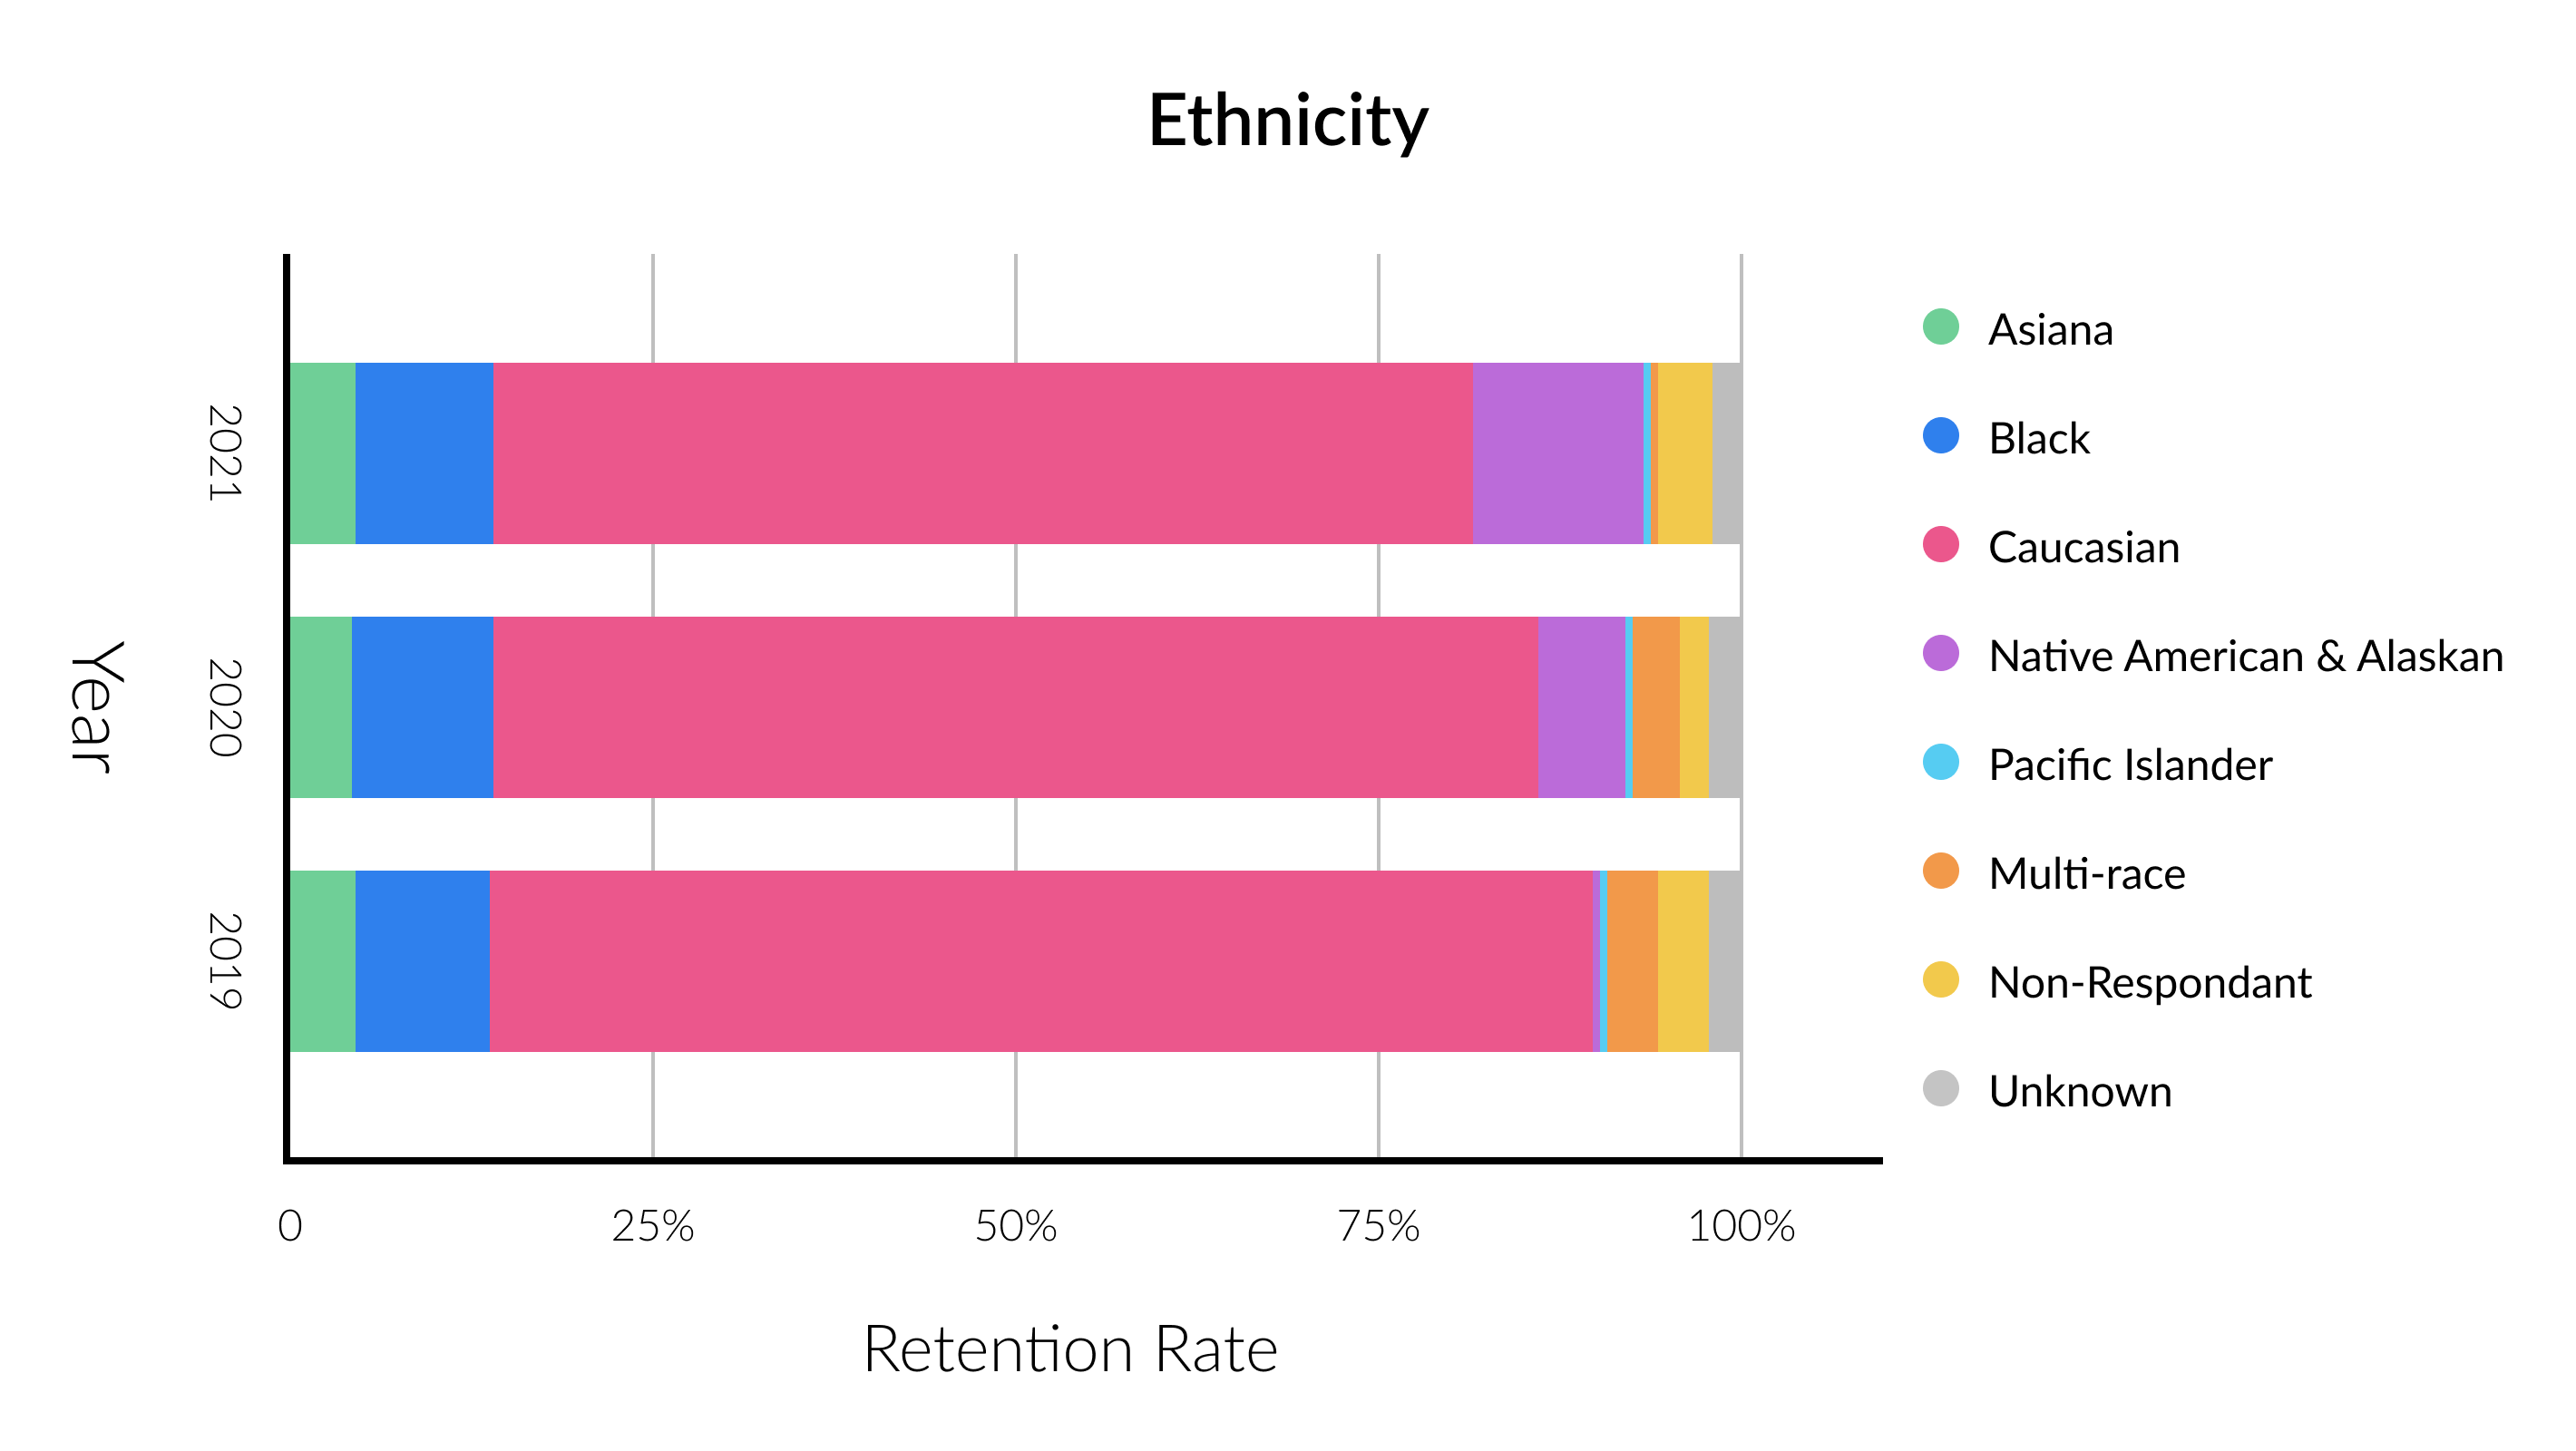
Diversity
This semester, almost 29% of enrolled undergraduate students identified as either Asian, Black, Hispanic, Native American & Alaskan or multi-racial. In fall 2020 and 2019, almost 27% and 25% identified in the aforementioned categories, respectively.
According to Ball, transparency seems to be the key to recruiting students of various racial and cultural backgrounds.
“As a part of the University’s Strategic Plan, we’re working to better communicate the real strengths and understand the challenges that Bradley has in terms of diversity, equity and inclusion,” Ball said. “We do share with [prospective] students the data on the ethnic diversity of our student body.”
In summer 2020, President Stephen Standifird said Bradley would be giving several full-tuition scholarships to committed students in the Peoria Public Schools System. The Peoria School District has under 20% white students in its system, while there are almost 57% Black students in the district.
Additional data stated that less than 65% of the Bradley student body identified as Caucasian this semester compared to 2020 where almost 68% reported as Caucasian. The earliest statistical profile on the site, fall 2013, stated that over 72% of the student body was listed in the category.
Just under 6% of total Bradley students didn’t identify their ethnicity or listed as “unknown” this semester.
Test score averages
The average ACT score for the first-year undergraduate class dropped four points, from 25 being the average score since 2012 to 21 being reported for this semester.
Since 2020, Bradley hasn’t reported any SAT scores from the incoming class.
While Bradley hadn’t required SAT scores for potential students, universities across the nation have reconsidered their need for the SAT on applications. This has been adopted mostly due to the COVID-19 pandemic.